Stock Market Statistical Analysis
As previously mentioned, Mr. Dougherty has created a 20 variable statistical model to analyze the intrinsic value of the S&P 500. Many of the variables are traditional economic indicators, widely used commodities, and some esoteric yield indicators. The model is not used as a trading platform, but rather a tool for assessing the market's rationality and implied risk.
Valuation Modeling
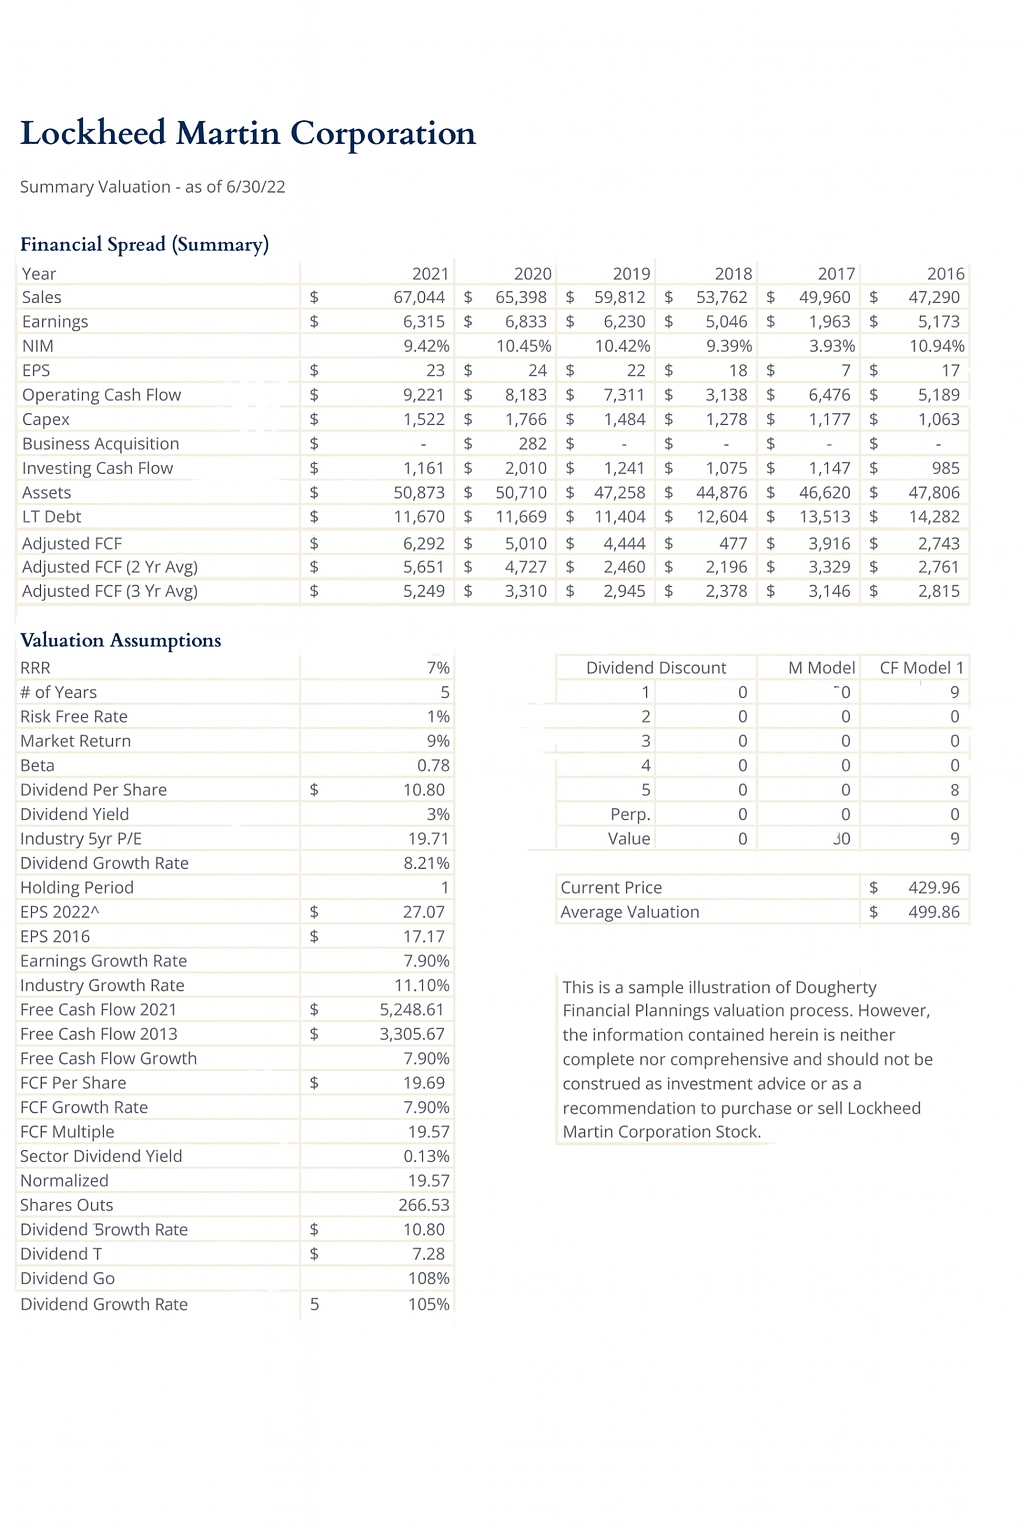
After a thorough assessment of the marketplace, Mr. Dougherty analyzes individual stocks using fundamental analysis and valuation models. Mr. Dougherty uses a composite of 3-5 valuation models over 8-10 years of historical financials to determine an individual securities value. Generally, securities with less than a 2% dividend will be culled; but certain exceptionally well priced or positioned companies may be purchased.
Diversification
Diversification is the staple of any well built investment strategy. A portfolio tends toward diversification when it holds 20+ random investments, and Dougherty Financial Planning generally adheres to this rule. But when is diversification wrong?
Many passive investment strategies rely on large extremely diversified ETFs. What if a client is a high level employee in a healthcare company, or a successful IT/online marketing business owner? Should that individual own healthcare stocks, or Google/Amazon, respectively?
The healthcare industry is about 14.5% of the S&P 500, and google and amazon are 6.9% of the S&P. Being heavily invested in the sector in which you are employed is probably a bad idea.
Diversification and its problems
Efficient Market Hypothesis (“EMH”) would have us believe that diversification is simple math.
The prescription is as follows: Backtest the asset (investment is all financial assets not just equities.) universe for returns and volatility. Optimize for minimum co-variance. Buy short-term Treasury Securities to address risk aversion.
The practical retail and passive investment application to buy the S&P 500 ETF and Treasury Bills. The EMH prescription denies diversification from systemic risk and personal assets, and the passive application doesn’t mean covariance.
VS
Diversification is part math, art, and common sense. Below are some diversification phenomena worth discussion.
S& P 500 Sector Breakdown
If you are engaged in passive or robo investing in the S&P 500, 28% of your equity holdings are invested in Information Technology. Doesn’t that seem excessive to you?
Personal Diversification
The efficient market hypothesis calculation leaves out the most important part of the analysis, the clients personal wealth and experience. Firstly, most middle and upper class Americans build significant wealththrough real estate via equity in their home or other outside investments.
Depending on your real estate wealth, we should consider minimizing real estate holdings in your portfolio. Secondly, most American’s have significant paper worth from the net present value of their employement or business ownership. If you are an information technology professional, holding S&P 500 ETF is probably not the best way to diversify.
Diversification Resistance
Systemic Risk
Diversification by minimizing portfolio co-variance only diminishes idiosyncratic risk, or the financial risk of specific firms or investments. It does not diminish the underlying risk of the economic, financial, or equity market system.
Asset Bubbles
Have been recorded throughout history, whether it’s tulips, fledgling tech stocks, real estate, or cryptocurrency, the only strategy is to stay away.
Excess Volatility and Increasing Covariance
Equity markets are more volatile than they should be. It is documented in many scientific papers. The best way to reduce the excess volatility is to overweight flight-tp-quality-assets or sell short. For the average investor, treasury bills and notes are the right move. Businesses that own inferior goods may be worthwhile as well.
Nasdaq Composite Return
1/1/96 - 3/31/01
S&P 500
Weekly Return Distribution
Risk & Limiting Volatility
The market's preferred measure of risk is based on standard deviation. The problem with using standard deviation for risk assessment is that it is not well suited for the “smile,” an arcane way of saying the returns of the stock market don’t fit a bell curve well.
Simply put, the market has a well documented phenomena of walking up two flights of stairs and falling off the balcony. Everyone wants to forget the horrendous returns of March 2008 to 2009 when the Dow was down 59%, or the tech bubble bursting from 10/2000 to 10/2002, when the non-tech Dow was down 34%.
This phenomena can be tamed (although not eliminated) with a combination of common sense, diversification, inverse ETFs and/or treasury securities, and inferior goods.
S&P 500
DotCom Drawdown
Dot-Com Drawdown
The losses generated from the 999 tech bubble are long forgotten. However, it’s important to remember the irrationality and valuations of the time. I would argue that certain parts of the market today are exhibiting similar traits.
Unusual Duration
The tech bubble drawdown for the S&P is unusual because it was relatively slow and orderly. Peak to trough was 31 months with a loss of 45%. This loss is outside of most clients’ risk assessment psychology and is an excellent example of the downside risk of the stock market.
S&P 500
Real Estate Drawdown
Great Recession
I graduated from college in May 2009, and was tossed into one of the toughest job markets for finance majors. I’ll never forget that experience, nor will many other Americans. Additionally, I was a JR. Analyst at a quaint hedge fund during this decline, and watching the sky fall while the fund management sat on the sidelines was surreal.
Seed and Duration
The ferocity and duration of the selling is nearly unmatched. From peak to trough was 17 months, and the loss was 56%. The only safe haven during this time was treasury securities.
S&P 500
Covid-19 Drawdown
Fast but Short
The Covid-19 drawdown is recent history, and I won’t rehash it here. The market action was typical of an unexpected stress event. It was clearly an overreaction (financially), and not panic selling during this time rewarded savers well.
Conclusion
Steep, intense, and scary declines are part of investing. And, unfortunately, they are generally unpredictable. The best way to shield yourself from these events, is to approriately asses your risk appetite, and devote part of your portfoilio to fight-to-quality assets,